Stocks
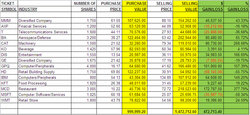
For this assignment, I had to create a spreadsheet using Microsoft Excel for the stocks of different companies. In order to complete this assignment, I had to insert formulas to calculate the purchase value and selling value of the stocks, as well as the amount and percentage of money gained or lost. Questions about the data compiled were answered at the end. I learned a lot about the stock market through this activity. It was interesting to get a glimpse of how the stock market works and how prices and gains/losses change daily. The questions at the end helped with this because one question asked which stock would make a profit in the future. So, using the spreadsheet, I had to guess which stock values would continue to increase. Another thing that I learned was how to display negative percentage values in red. This was done by formatting the column as numbers and clicking the option that involved displaying negative numbers in red with parathenses. Overrall, I think I did well in all aspects of this assignment. I just used the Excel tools that I have been practicing. Other than the concept of stocks, no new aspects of Excel were used. One thing that I would do to improve this assignment would be to change the formatting of the table. Personally, I did not like the way the directions said to format it. So, if given the chance, I would have made the table more visually appealing. Clip art or another form of picture may have been added as well.
Excel 22
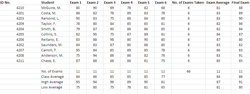
In this assignment, I created a grade book spreadsheet using Microsoft Excel. To complete this assignment, I had to use many of the formulas I have learned in class, especially to average grades on the many exams. I also had to analyze the data to answer questions based on the grade book spreadsheet. During this activity, I learned how to find the low average and high average of each exam but using the maximum and minimum tool. I also learned to use the count number tool, which counted the number of items (exams) instead of the actual grade numbers. Other tools that were used were the sum and average tools. No aspects of this assignment were too hard for me to complete. It was easy for me to follow the directions and insert the correct equations needed to determine all of the different averages. One thing that I feel I can do well is copying formulas to different cells. This makes the assignment easier and quicker to complete. To improve this assignment, I would definitely format the table in a different way. The formatted table would be colorful and more visually appealing. This would make the spreadsheet less bland.
Column Chart Project
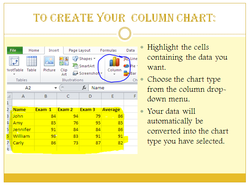
For this group project, my group had to create a class activity as well as a presentation, that included a powerpoint and a demonstration, on how to use and create column charts in Excel. In order to complete this assignment, we first had to learn how to make column charts ourselves before teaching the class. This was done used the SNAP Excel tutoritals. In the powerpoint, the steps on how to make a column chart were listed along with the purpose of the chart. In the class activity, data was created and directions were made on how to complete a column chart for the data. The directions also mentioned which formatting tools to use. During this assignment, I learned how to collaborate with others in my group. This was the first group project in this class, so I talked and worked with people who I wouldnt normally interact with. This taught me important people skills that will help me when I enter the work-force and have to communicate with co-workers. I also learned about many of the different type of charts from the other groups who presented. One chart in particular that I did not know about before this activity was the area chart. So, I felt like I actually learned something from that presentation. For me, the hardest part of this project was presenting the demonstration on how to make a column chart to the class. This is because sometimes it is difficult to explain a topic to a group of people who may not have been exposed to it previously and present the information in a way that makes sense to the audience. Although this was the hardest part of the project, I feel like it is also the part that I did well with since I am good at public speaking. It was also easy for me to create the class activity because I used other activity directions as my guidline. To improve this assignment, my group should have evenly distributed the presentation more. I felt like I talked too much and the others not enough. Another thing to improve on would be the class activity. When the class completed it, there were many questions. So if given the chance to do it again, I would try to make the directions more clear.
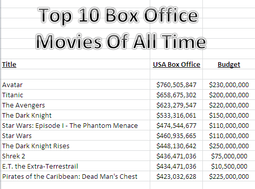
iPhone Games
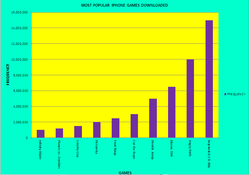
For this activity, I had to create a column chart of the top downloaded iPhone games using Excel. To complete this activity, I first had to make and format a spreadsheet of the information needed for the graph. I then used the skills learned in the column chart project to create a column chart using the data in the spreadsheet. This activity required me to use the fill tool as well as the tools to format the axis. One thing that I did learn how to do was change the scale on the y axis so that the tops of the bars on the graph were shown. I also learned how to rotate the text on the x axis 90 degrees. The two things I learned how to do were also the things that I had most trouble with in this assignment. This is because it was difficult for me to find the tools to format it on the screen. To improve this assignment, I woud probably insert clip art of an iPhone to go with the graph. This would make the graph nicer to look at, and would also connect the iPhone with the games mentioned.
Yacht Mortgage
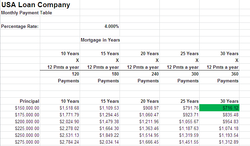
The purpose of this activity was to create a spreadsheet of data for monthly payments needed to pay back certain loans over a designated period of time. In order to complete this assignment I first had to determine how many payments a loan required to be payed off. Then, using the principal loan amount, I used the PMT formulat to determine the monthly payments that would need to be made to pay off the loan in that given amount of time. This formula was only of the things I learned during this assignment. I also learned a little more about loans and the idea of paying interest. The longer it takes to pay a loan off, the more amount of interest needs to be payed. At the end of the activity I also had to be able to answer questions about the data compiled in the finished spreadsheet. Overrall, I thought I did well with all parts of the assignment. The hardest part for me was using the PMT formula because it was a new concept. Other than that, however, everything else was completed easily. In order to improve my work for this assignment, I would re-format the spreadsheet. This is because during this assignment, I just left the spreadsheet without formatting it in any way. Re-doing this would allow me to use more colors, and set up the spreadsheet in a more appealing way.
